Tables, listings & figures, built for publication
IGO is an integrated visualization application for generating tables, listings, and figures for research and publication, with interactive, immersive views of clinical and nonclinical data at the subject, group, or cohort level.
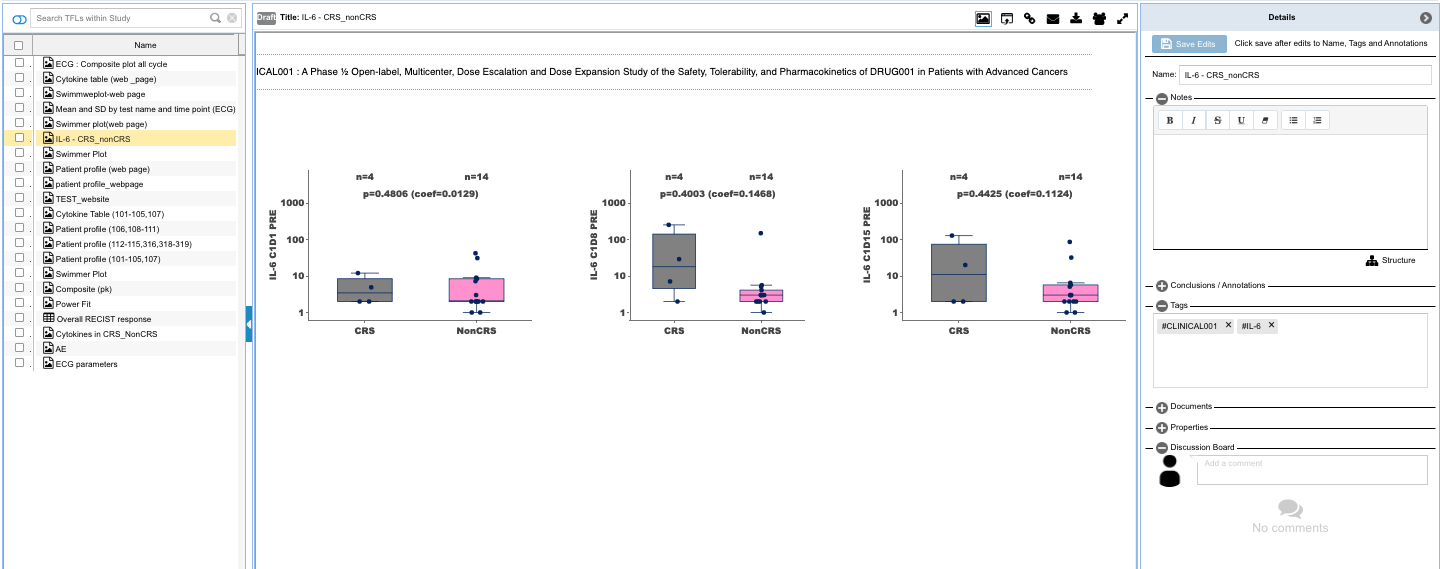
Explore the data, find the insight
IGO turns integrated study data into interactive views and analysis-ready outputs across subjects, groups, and cohorts.
Interactive, immersive visualization
Visualize, analyze, and tabulate data at the subject, group, or cohort level in one immersive workspace.
Longitudinal integration
Integrate EDC endpoints on patients with their biomarker data, longitudinally and in near real time.
Highly stratified cohorts
Select cohorts by clinical or nonclinical safety endpoints, biomarker data, health history, concomitant medications, and more.
Compare across studies
Compare or cross-analyze data from various selected cohorts or trial arms across studies in the repository.
From study timeline to the individual patient
Move fluidly between the whole study and a single subject, with every endpoint integrated in one longitudinal view.
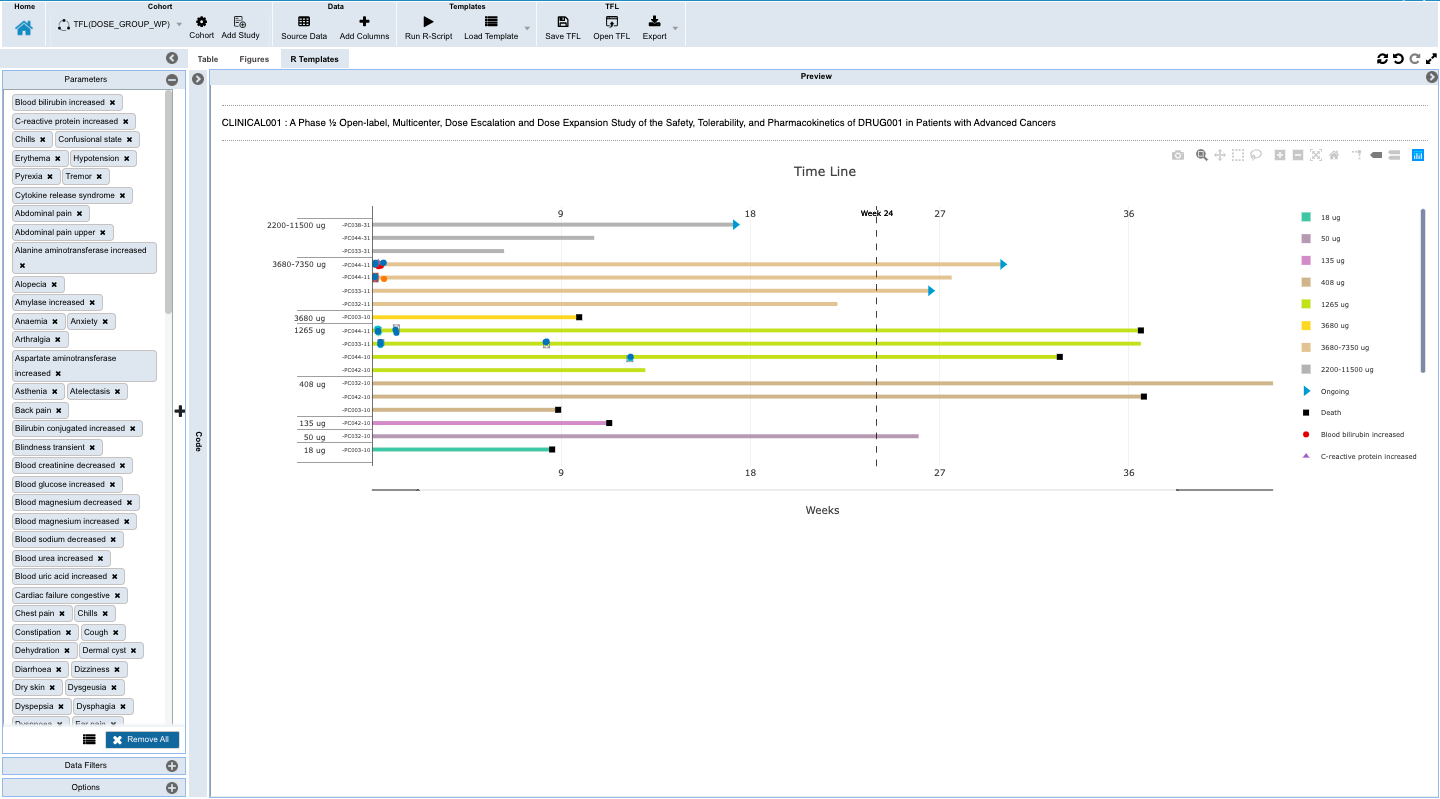
Overall study timeline view
See the full timeline of the ongoing study with events laid out in sequence, giving the team one shared picture of where the trial stands.
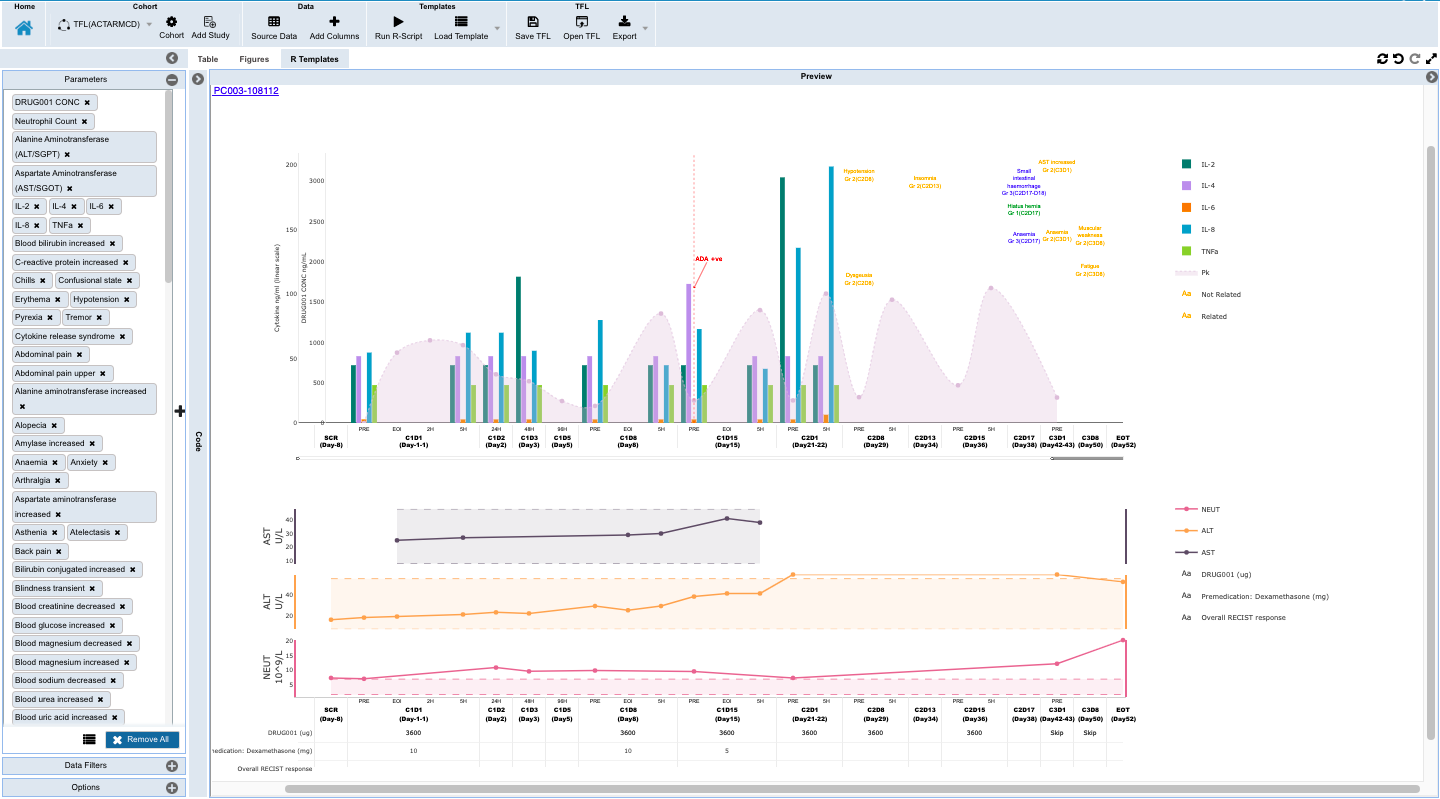
Individual patient longitudinal view
Monitor individual patients for safety and efficacy in an integrated longitudinal view that brings together dosing, events, lab, PK, and biomarker data.
Ready to learn more?
PointCross Life Sciences Inc. delivers proven life sciences software solutions to support drug development through a suite of Nonclinical and Clinical offerings.
Stay up-to-date with personalized newsletters and schedule a call to explore how our life sciences software solutions drive efficiency in biopharma R&D.
Request more information
Fill in the form below and our team will be in touch.
