Cross-study analytics, visualized as Integrated Graphics Objects
A nonclinical study repository with study and cross-study search, analytics, and visualization. Capture insights as IGO-driven TFL objects, figures, tables, and listings, with annotations for any selected cohort.
Longitudinal integration for search & discovery
Disparate components of nonclinical studies are integrated longitudinally into a repository for search and discovery of signals or cohorts based on specified criteria. Researchers capture insights by generating IGO-driven TFL objects, and save them for future access and publishing.
Safety & toxicology analysis and visualization of study and cross-study analytics.
Data maintained in a Universal Data Model with harmonized terminology and normalized units for easy repurposing, including generation of SEND datasets.
Monitoring of interim data from ongoing studies.
Data loading and adaptors for disparate sources as well as SEND datasets.
Generate TFL objects with figures, tables, and listings, annotated for any selected cohort, and saved for future access and publishing.
Publication-quality figures, tables & listings
Integrated Graphics Objects render safety and toxicology data into interactive, annotated visualizations, ready to save as reusable TFL objects.
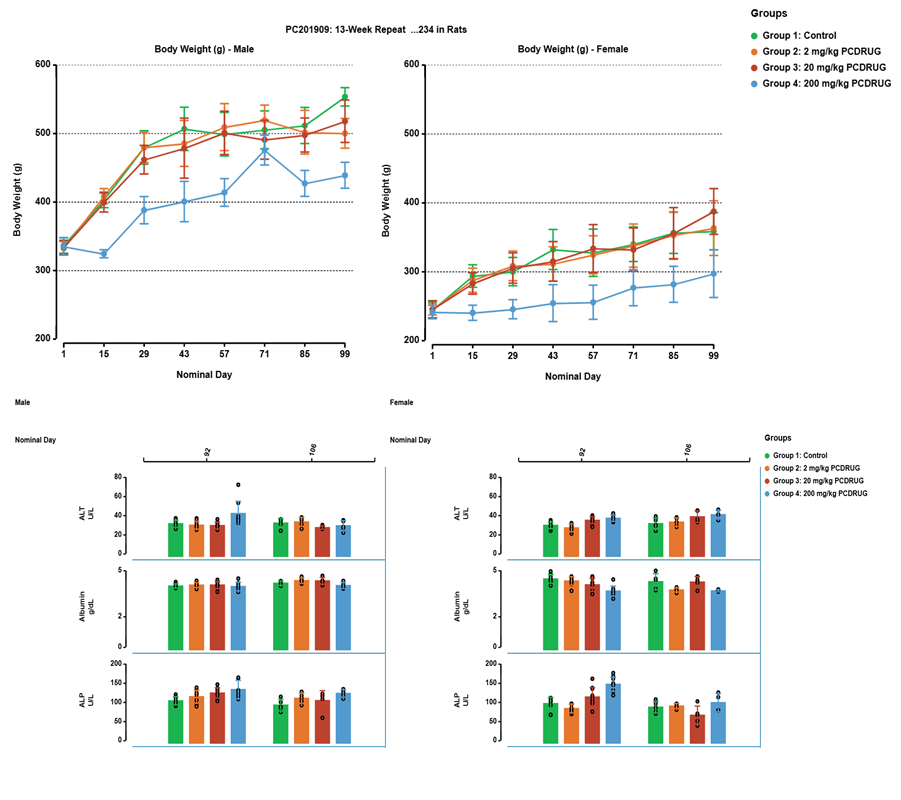
Body Weight & Lab Findings
The line graph shows how values change over time, with lines for the average and error bars for variation (SD). The bar graph compares group averages, with individual values "exploded" as dots per subject to show data spread.
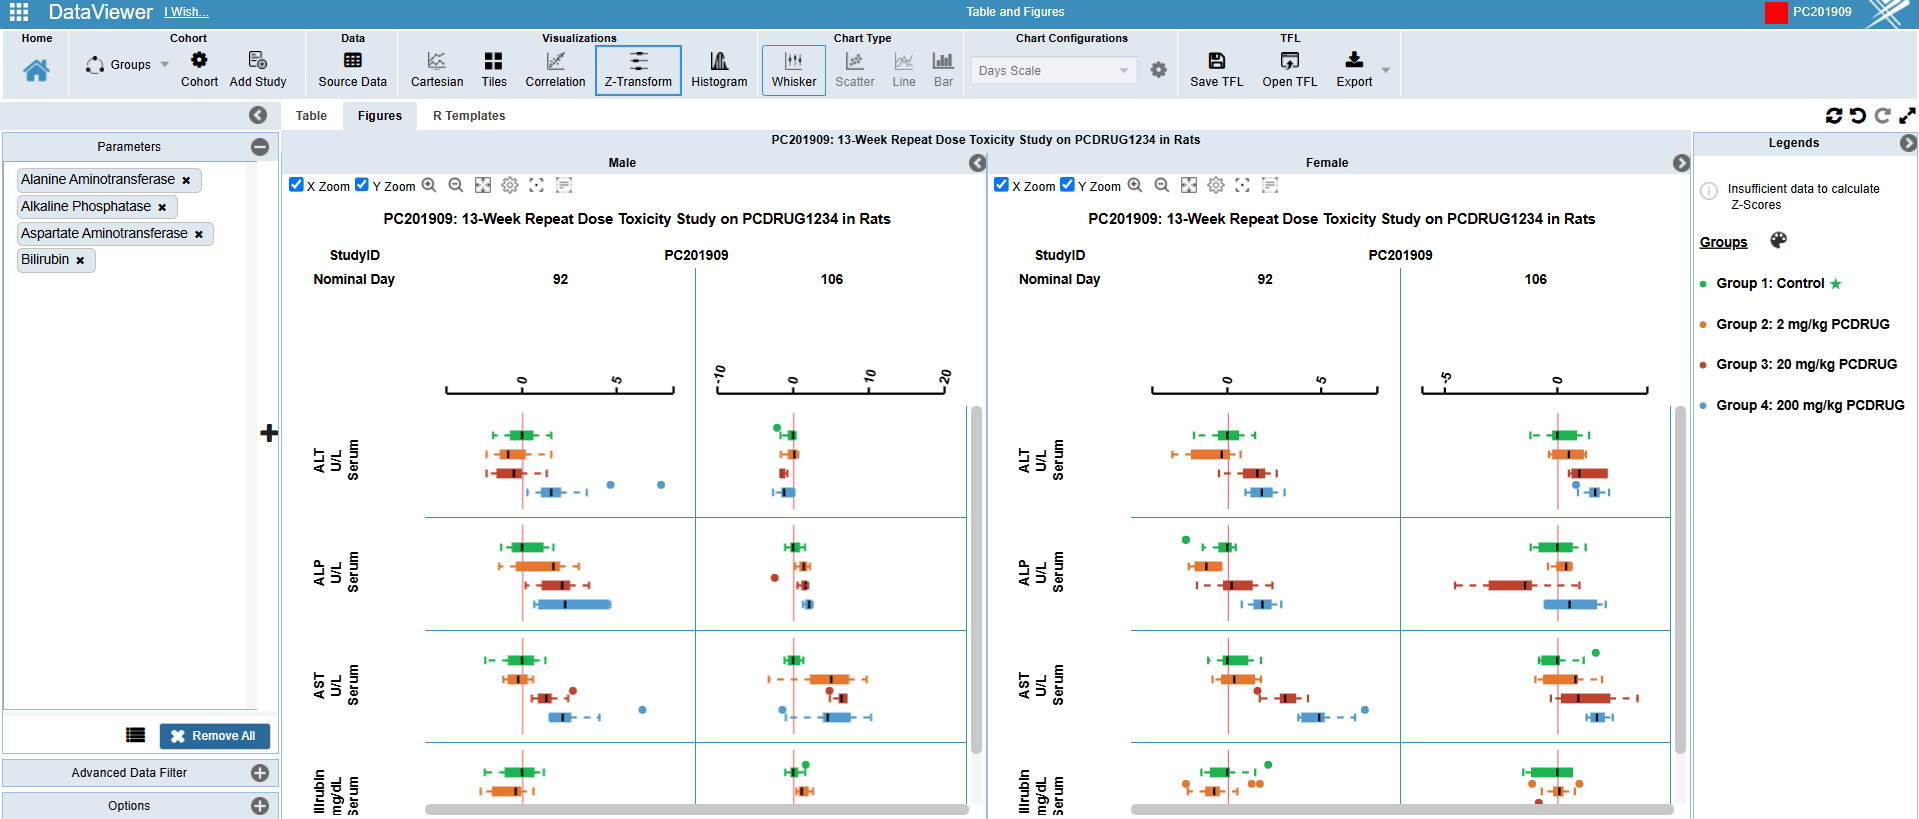
Liver Parameters
Shows changes in liver parameter values over time and comparison with the control group, normalized for clear cross-group interpretation.
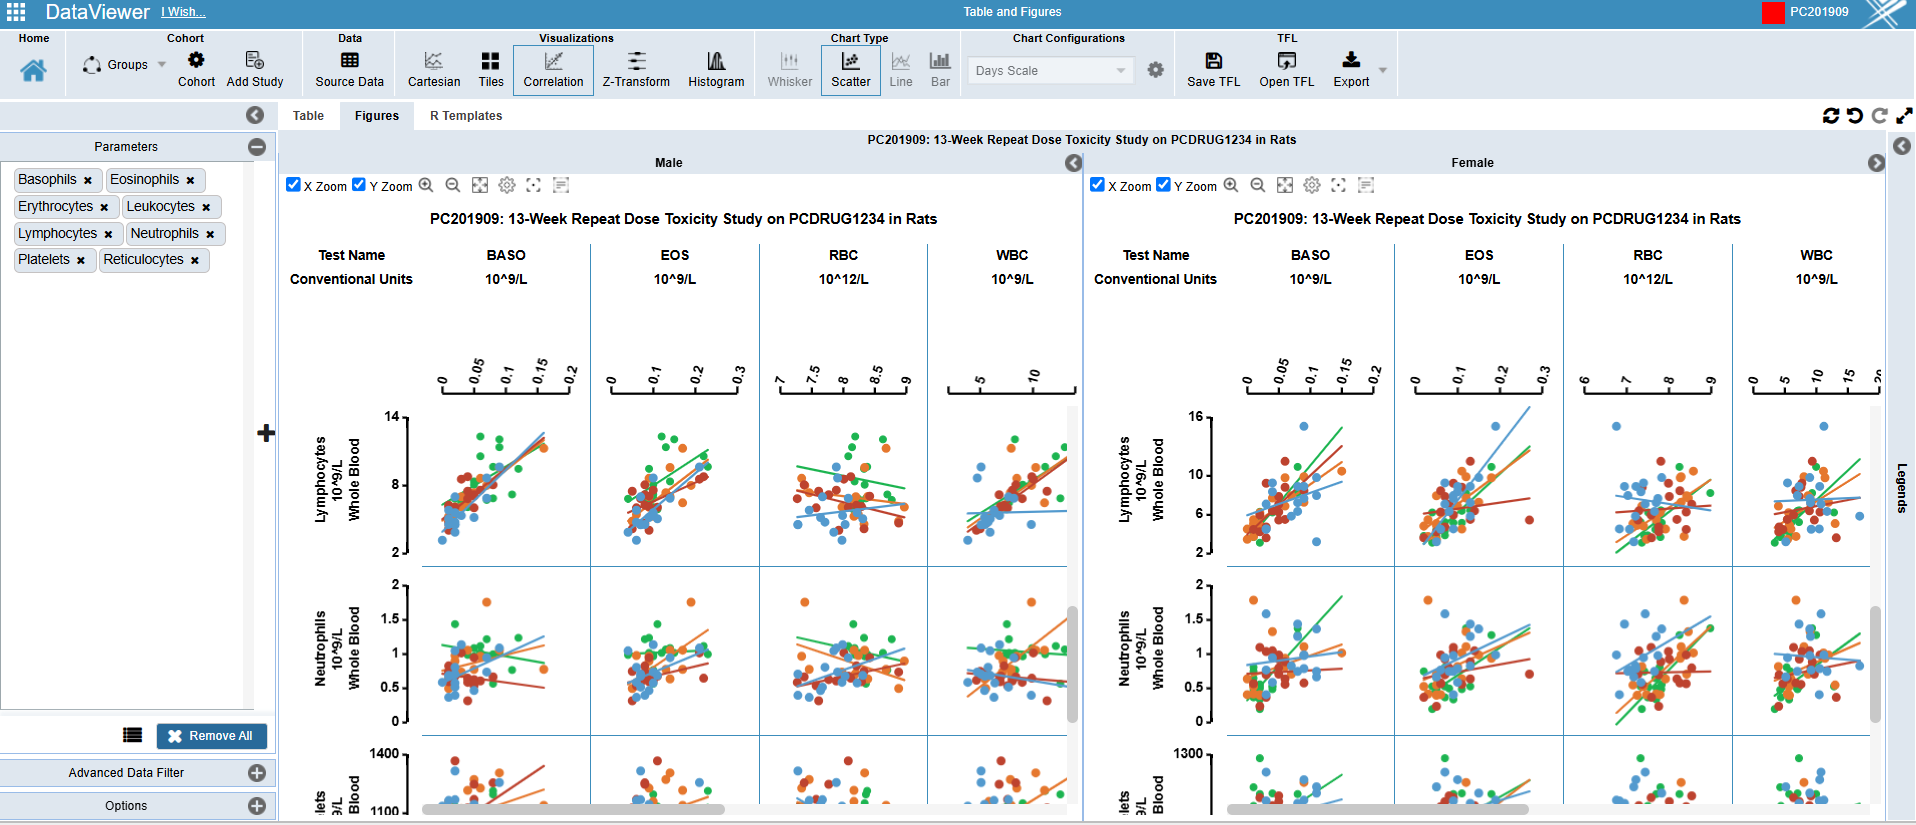
Regression Lines
Displays relationships between selected parameters with linear regression lines, surfacing trends and outliers across the cohort.
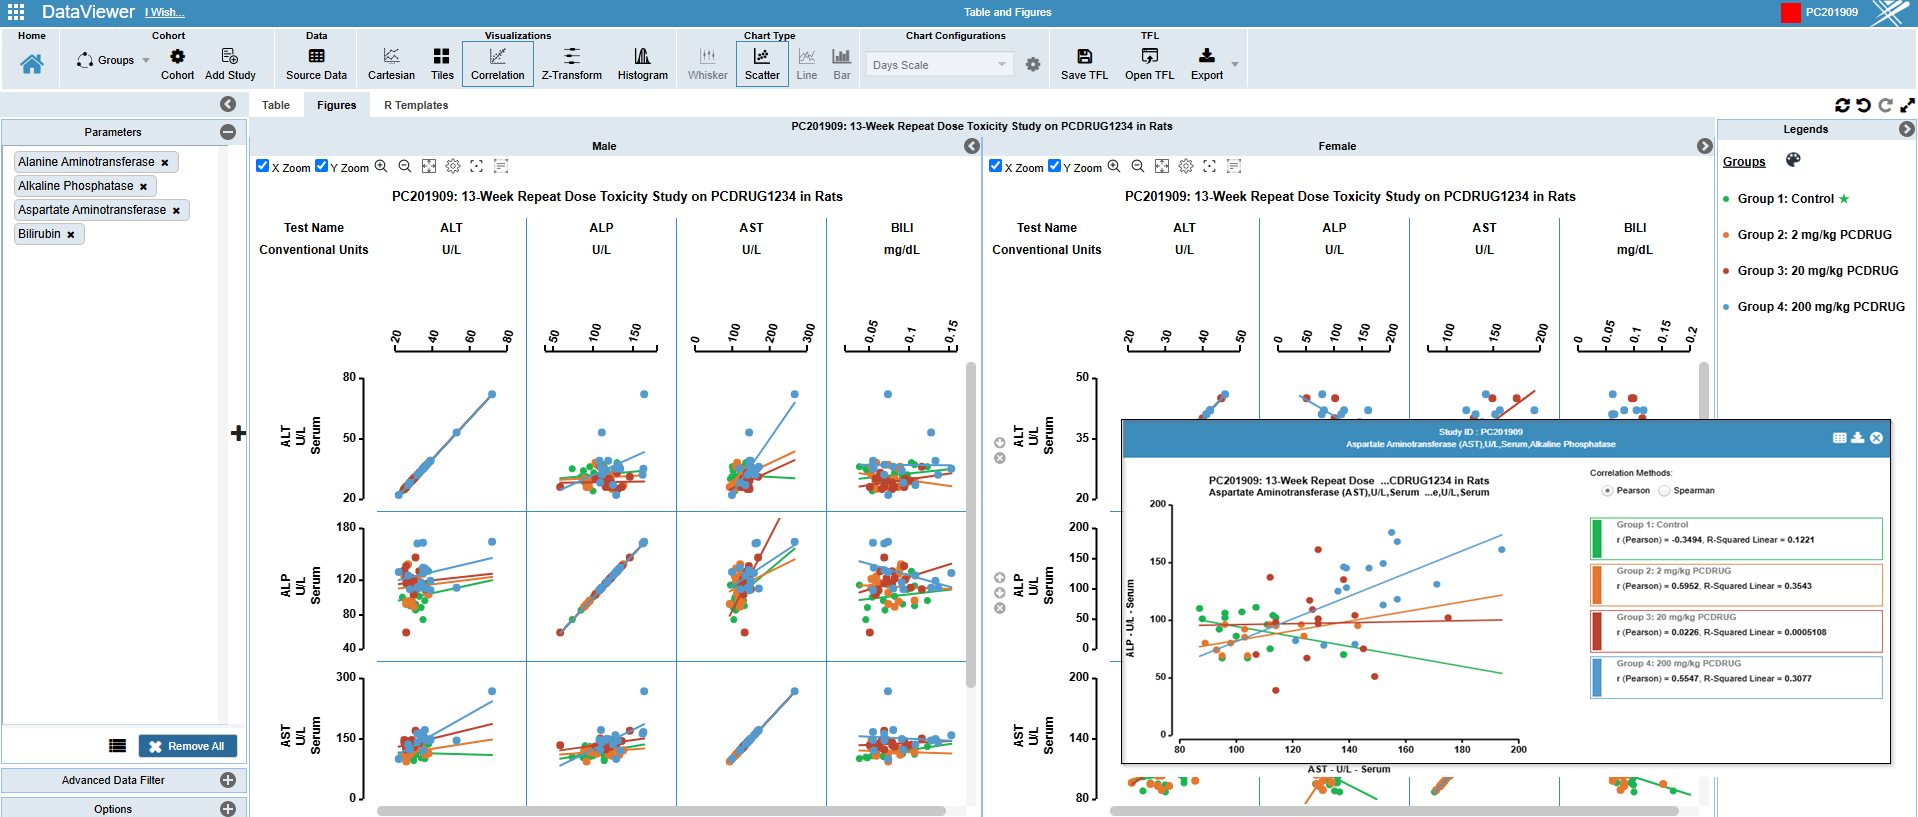
Liver Parameters · Pearson & Spearman
Calculates and presents the correlation strength between parameters using both Pearson and Spearman methods for comprehensive statistical insight.
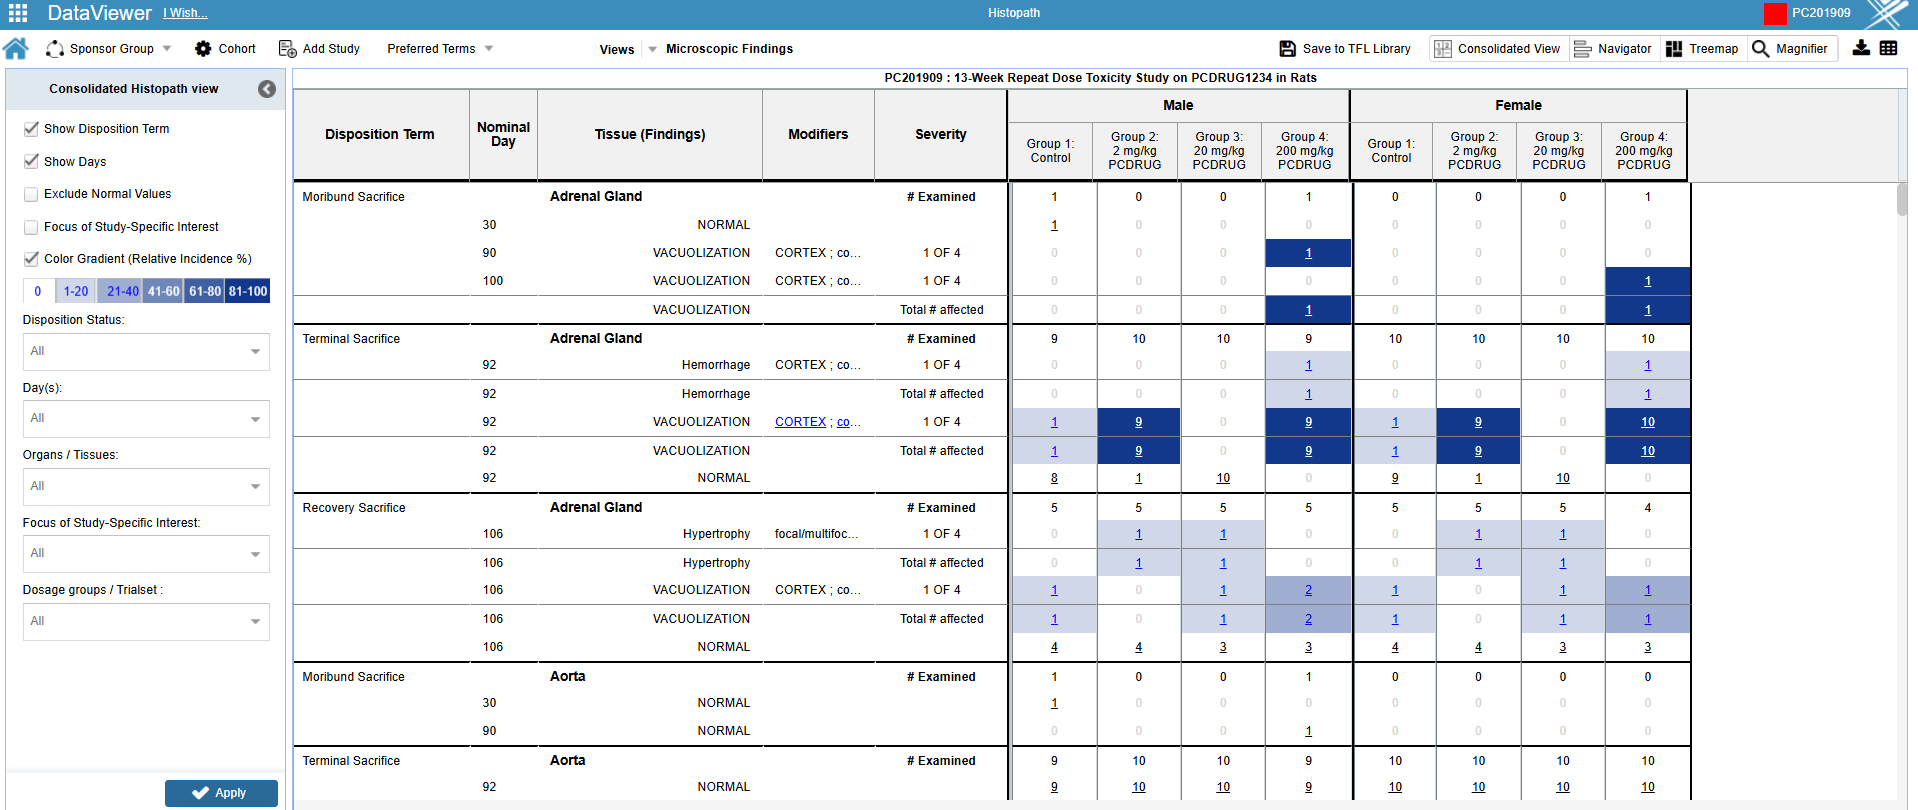
Consolidated View
Shows remarkable findings incidence organized by group, sex and organs in a heatmap view, for fast signal scanning across the study.
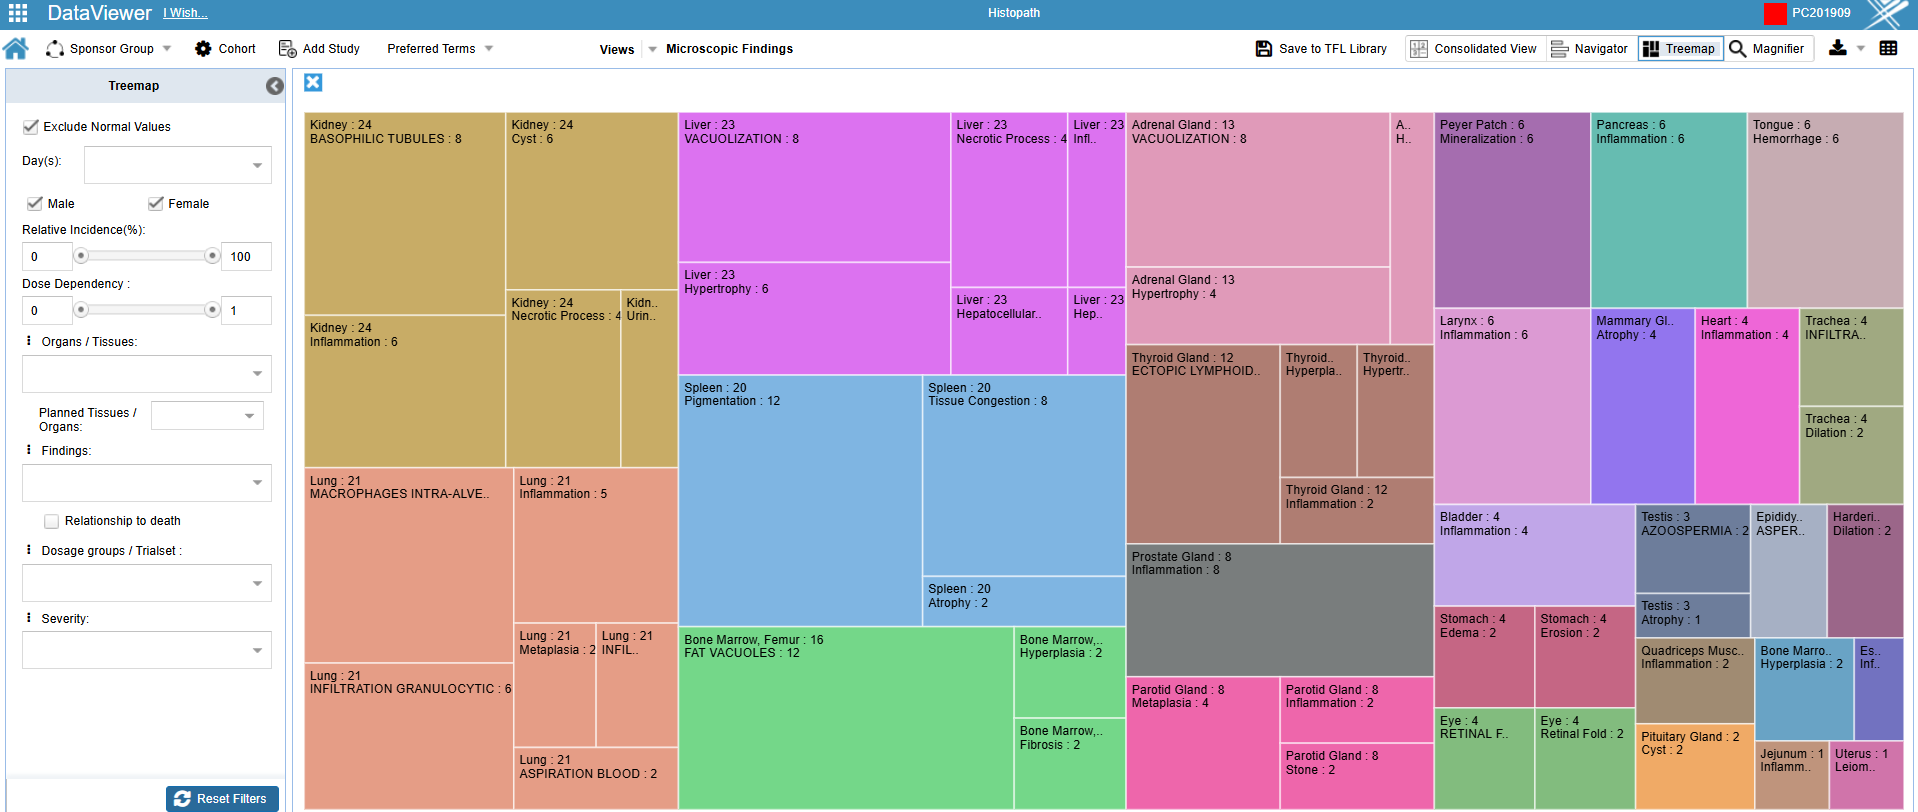
Treemap View
Displays data as nested rectangles sized by the number of subjects affected per organ and finding, making magnitude immediately legible.
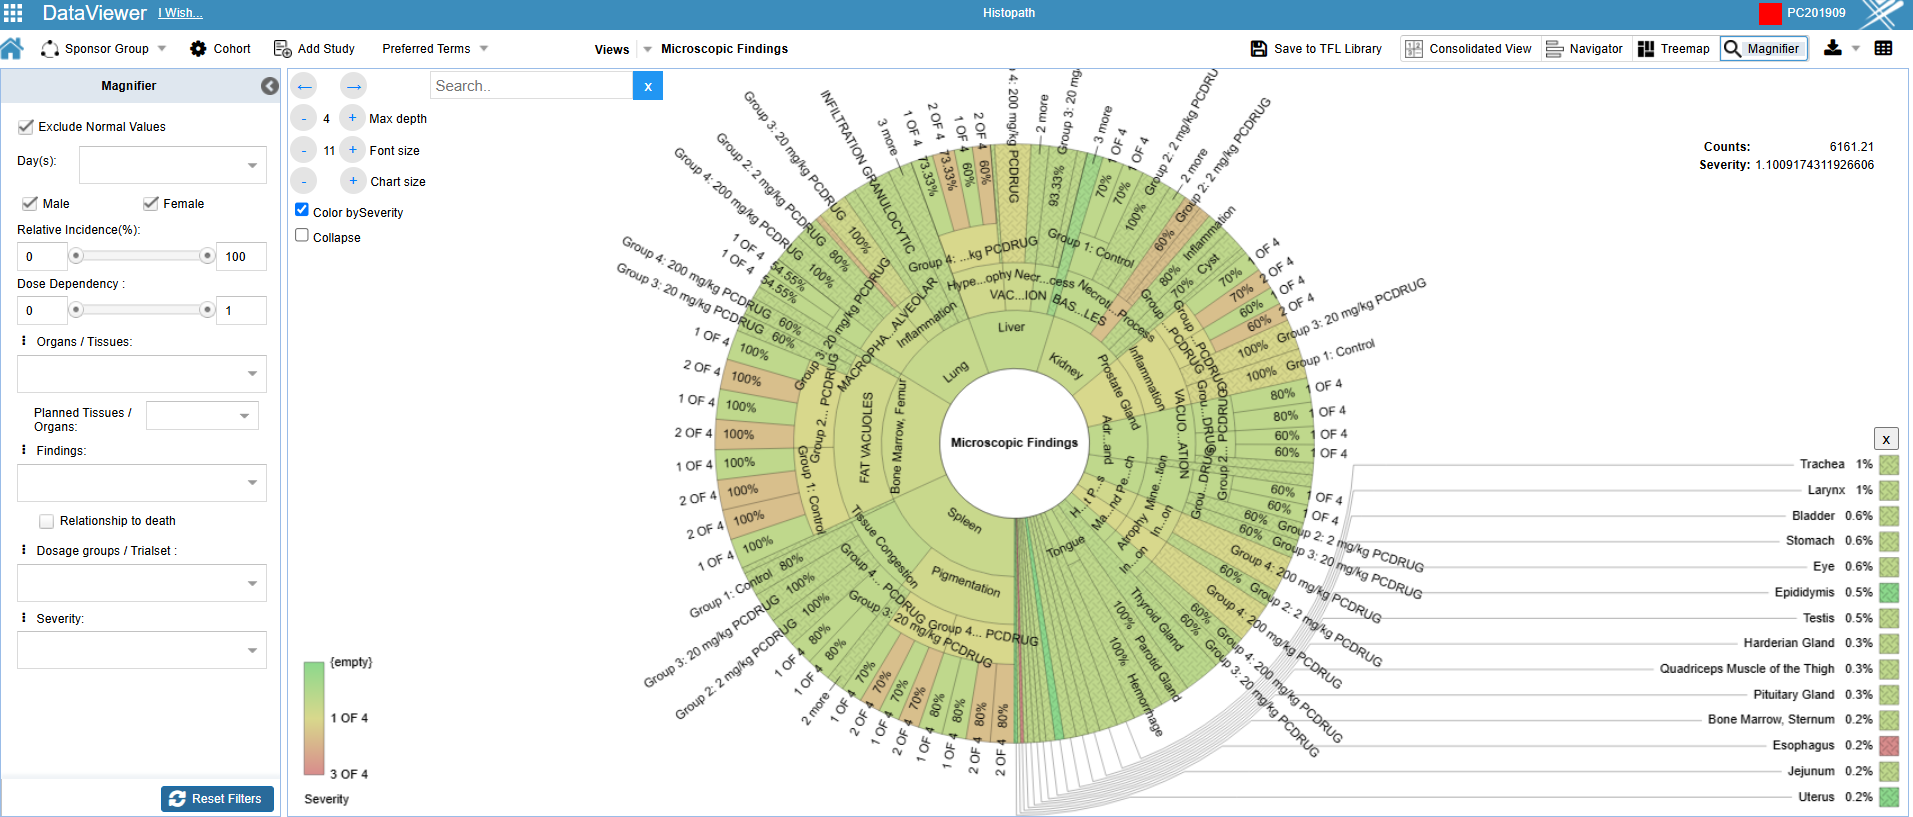
Sunburst & Magnifier View
Explore histopathology data in an interactive circular format, with zoom-in features to see deeper levels of information.
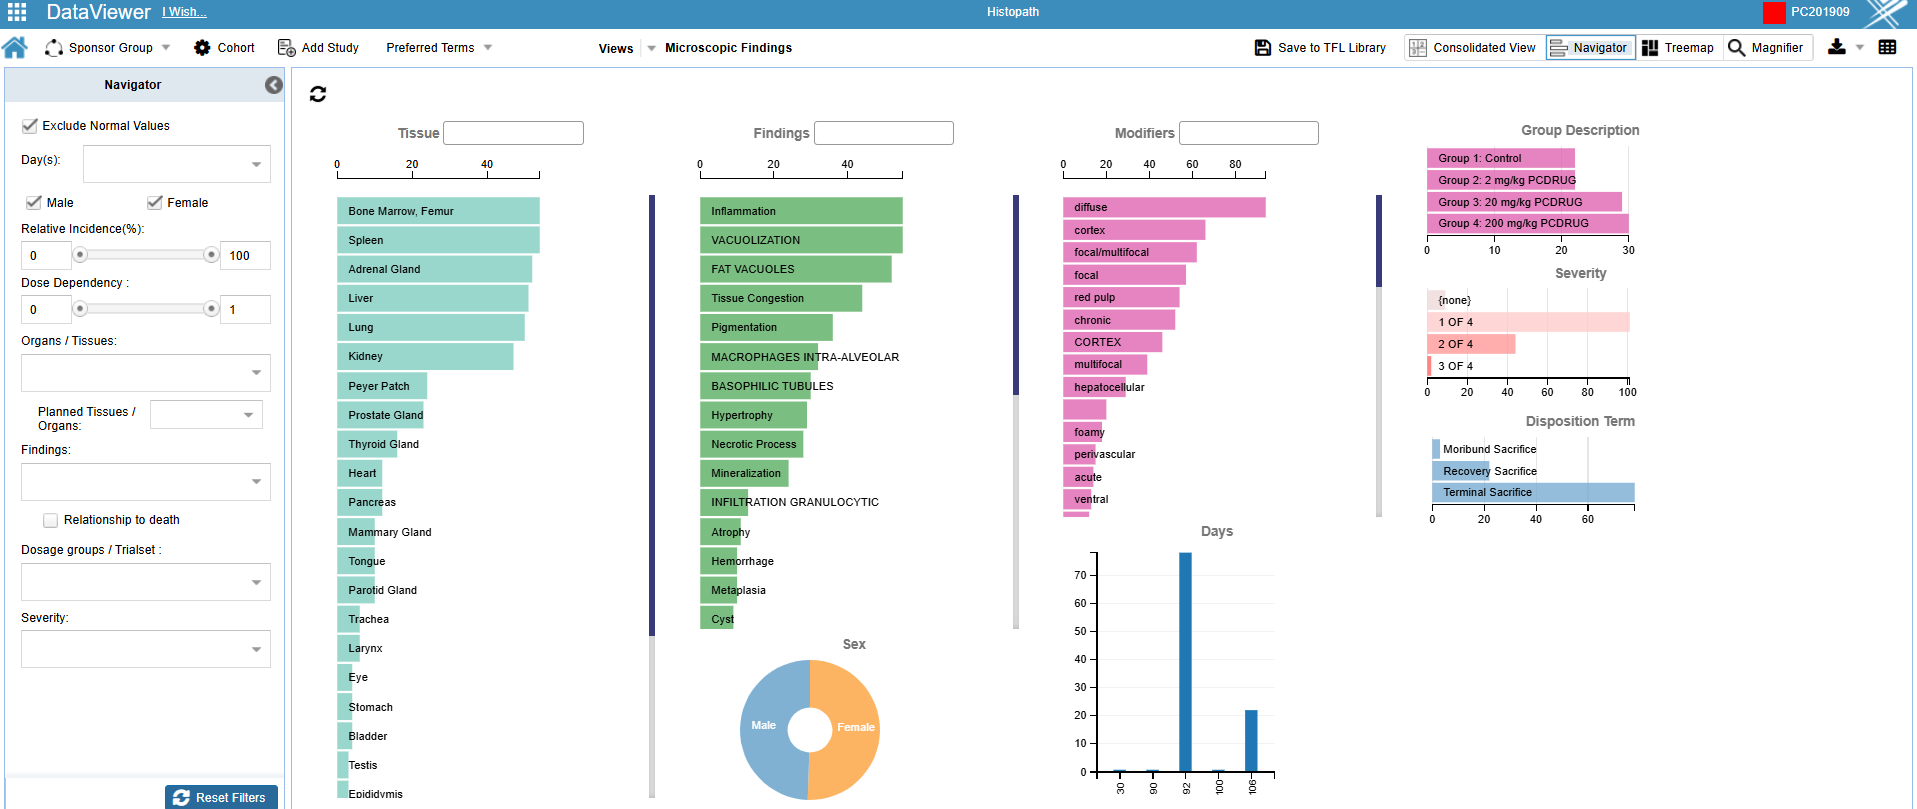
Navigator View
View and understand the data interactively using navigator charts, where any dimension, and all dimensions, adjust the data in real time.
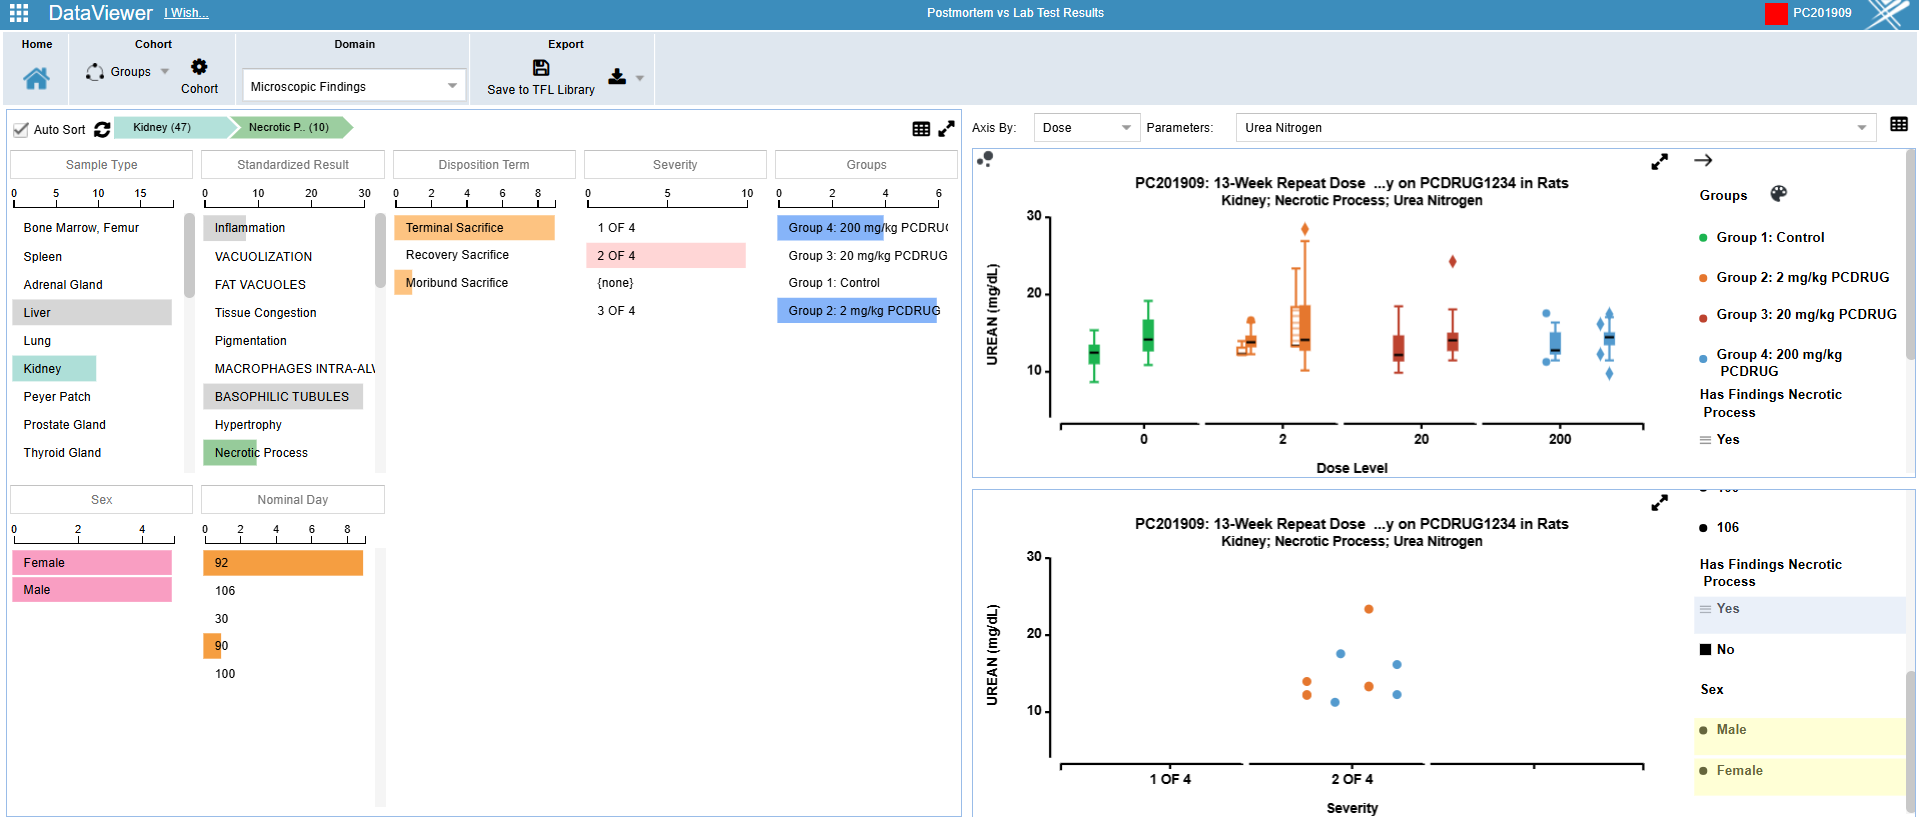
Histopathology & Necropsy vs Clinical Pathology
Analyzes histopathology and necropsy data compared to longitudinal or end-point clinical pathology results, linking findings across domains.
Ready to learn more?
PointCross Life Sciences Inc. delivers proven life sciences software solutions to support drug development through a suite of Nonclinical and Clinical offerings.
Stay up-to-date with personalized newsletters and schedule a call to explore how our life sciences software solutions drive efficiency in biopharma R&D.
Please fill the form for more information
Fill in the form below and our team will be in touch.
